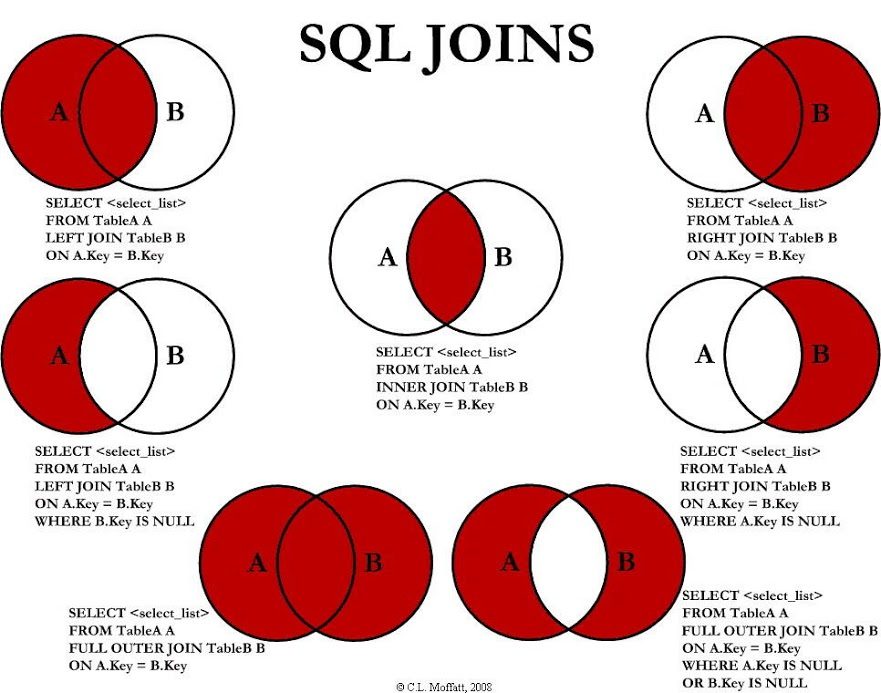
 A handy illustration explaining how left and right joins work in SQL, presented as Venn diagrams.
For some examples with actual data, check also this article by Jeff Atwood
h/t Ilya Grigorik, Data Visualization (on G+)
A handy illustration explaining how left and right joins work in SQL, presented as Venn diagrams.
For some examples with actual data, check also this article by Jeff Atwood
h/t Ilya Grigorik, Data Visualization (on G+)