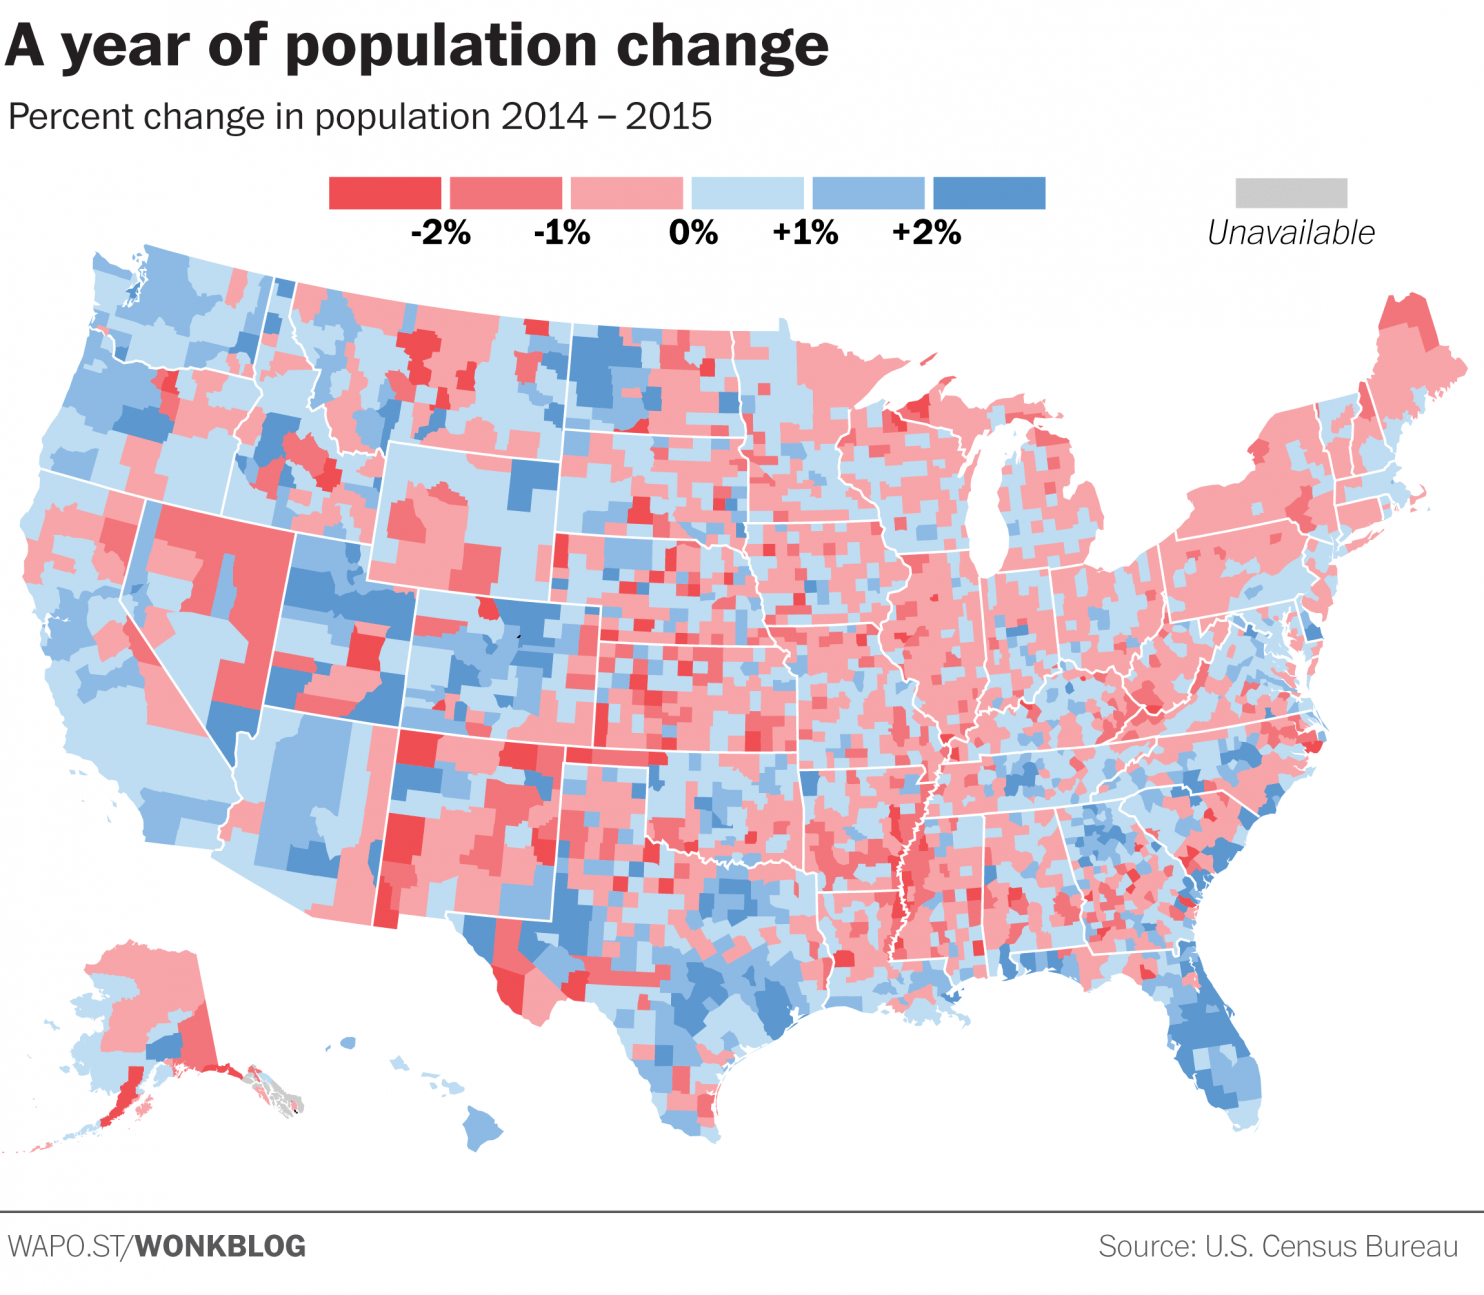
 When creating a visualisation of data, the colour choices and classes that your assigned too can change the message you're trying to present. In a world of fast moving readers and quick social media sharing, all that can be left from your data analysis will be a visualisation that might give the wrong message.
Read on: The dirty little secret that data journalists aren’t telling you