SWDchallenge: A low carb story
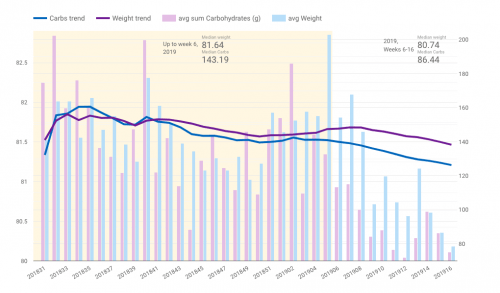
The theme of this month's Storytelling with Data challenge is "artisanal data". E.g. data collected personally by each participant, then analysed and visualised in a meaningful manner. I…
[Continue reading]The theme of this month's Storytelling with Data challenge is "artisanal data". E.g. data collected personally by each participant, then analysed and visualised in a meaningful manner. I…
[Continue reading]Storytelling with Data is a popular data visualisation blog by Cole Nussbaumer Knaflic. Every month Cole sets up a challenge for her readers. This month, the theme is…
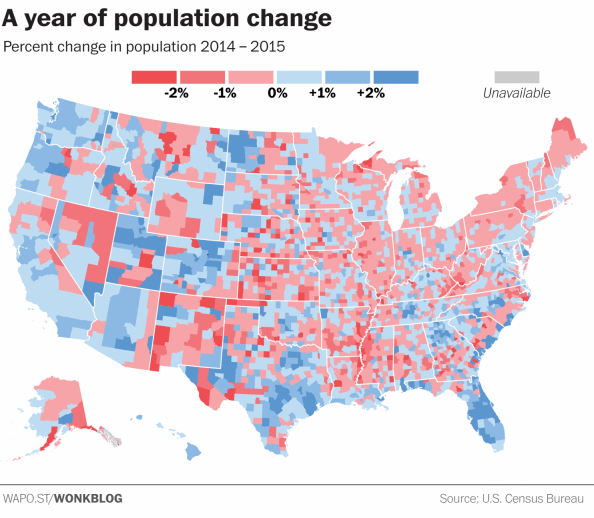
[Continue reading]When creating a visualisation of data, the colour choices and classes that your assigned too can change the message you're trying to present. In a world of fast…
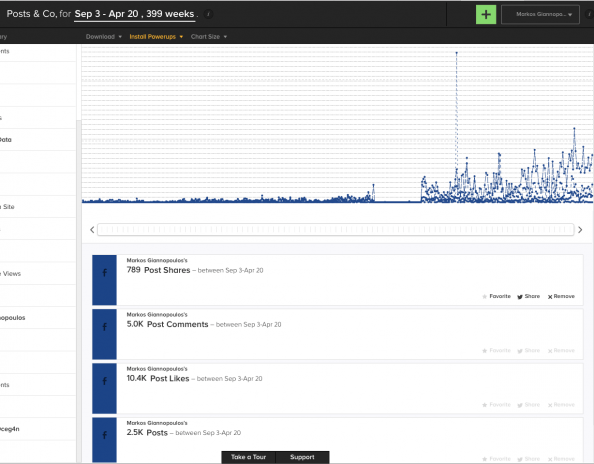
[Continue reading]I'm not sure I have seen any other service offer anything like that. In the screenshot you see what @SumAll has produced from my Facebook activity since the…
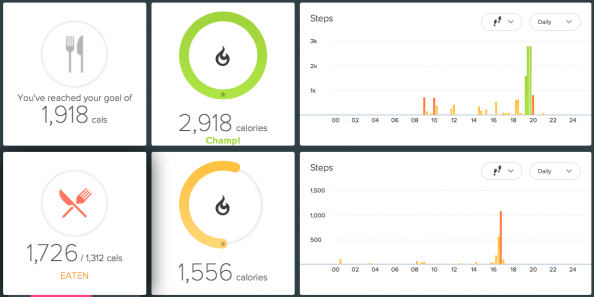
[Continue reading]Good friend Dimitris Dimitriadis (@insideabox) was writing about his use of self-tracking apps. I would like to explore this a bit further, in an effort to provide more…
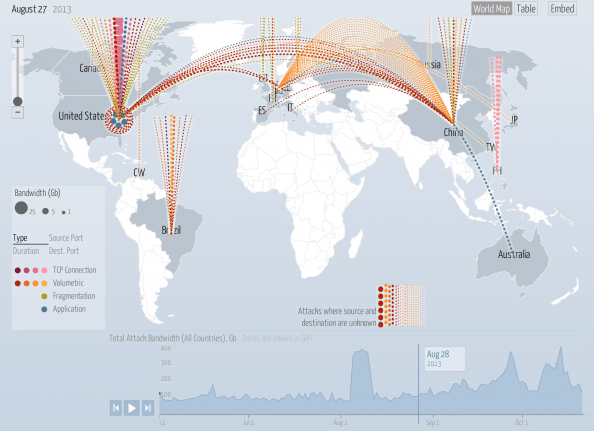
[Continue reading]The Digital Attack Map is a live data visualization, built through a collaboration between Arbor Networks and Google Ideas, that maps “distributed denial of service” (DDoS attacks) designed…
[Continue reading]